Ask your AI agent.
Get a professional dashboard.
Tell your coding agent what you want to understand. It sets up Trellum, builds and checks your report, and opens it in your browser. Start with sample data or bring a spreadsheet, file, API, or database. Point at what you want changed and refine it together.
For a manual install: python -m pip install trellum
▼ the synthetic portal preview below is interactive. Click a card, it opens.
uplift +4.1% · CI [1.2, 7.0] · CUPED
PDF · CSV · share link (scoped)
synthetic preview. Try the interactions here; for the full portal, follow the local try-it guide.
Ask your coding agent to set it up.
Open your project in Claude Code, Cursor, Codex, Gemini CLI, or another coding agent, and paste this prompt. Your agent handles installation, setup, and checks. You describe the report you want and review the result. SQL is optional, and the report’s source stays in your project so every change can be reviewed.
After the first preview opens, ask questions and describe what to change. The agent can update the report and rebuild it while you review the result in your browser. Read the framework guide for the technical details; the self-hosted portal is optional for managed schedules, authentication, and team sharing.
Set up Trellum in this project. Build my first interactive report with the included sample data, run the relevant checks, and open a live browser review. Keep listening for my feedback so we can refine it together.

Trellum: https://trellum.dev
Setup guide: https://github.com/trellumhq/trellum
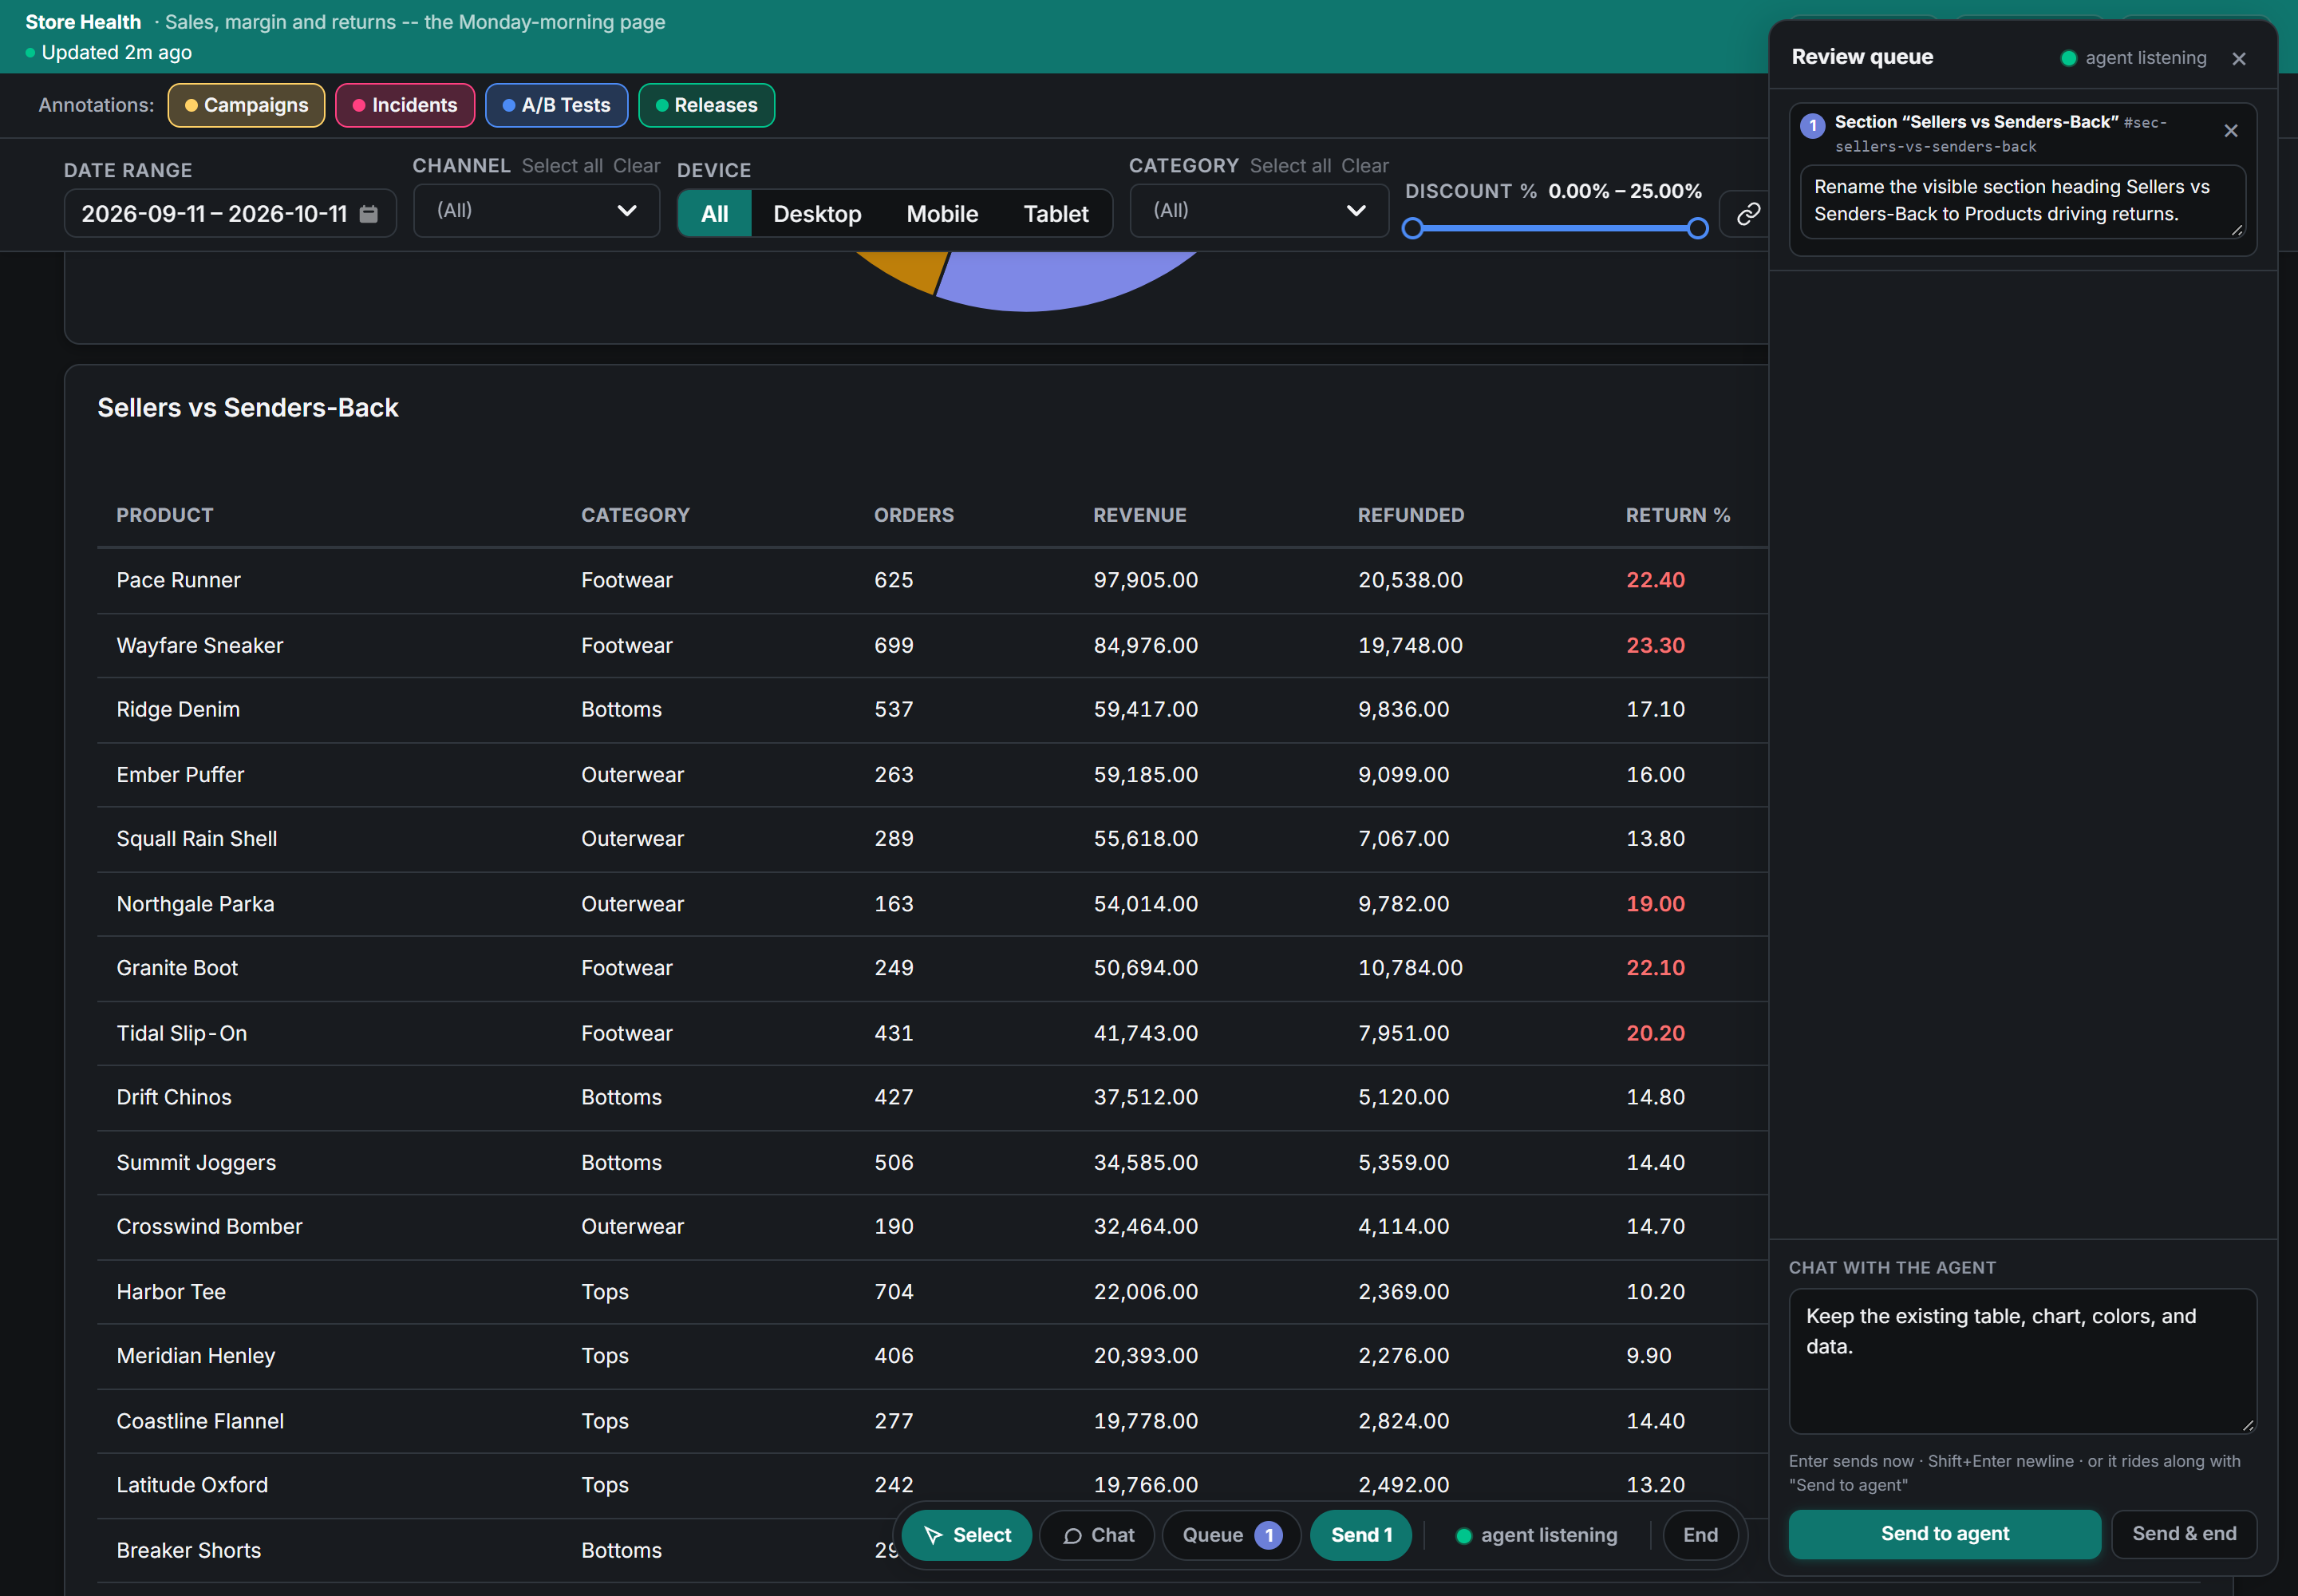
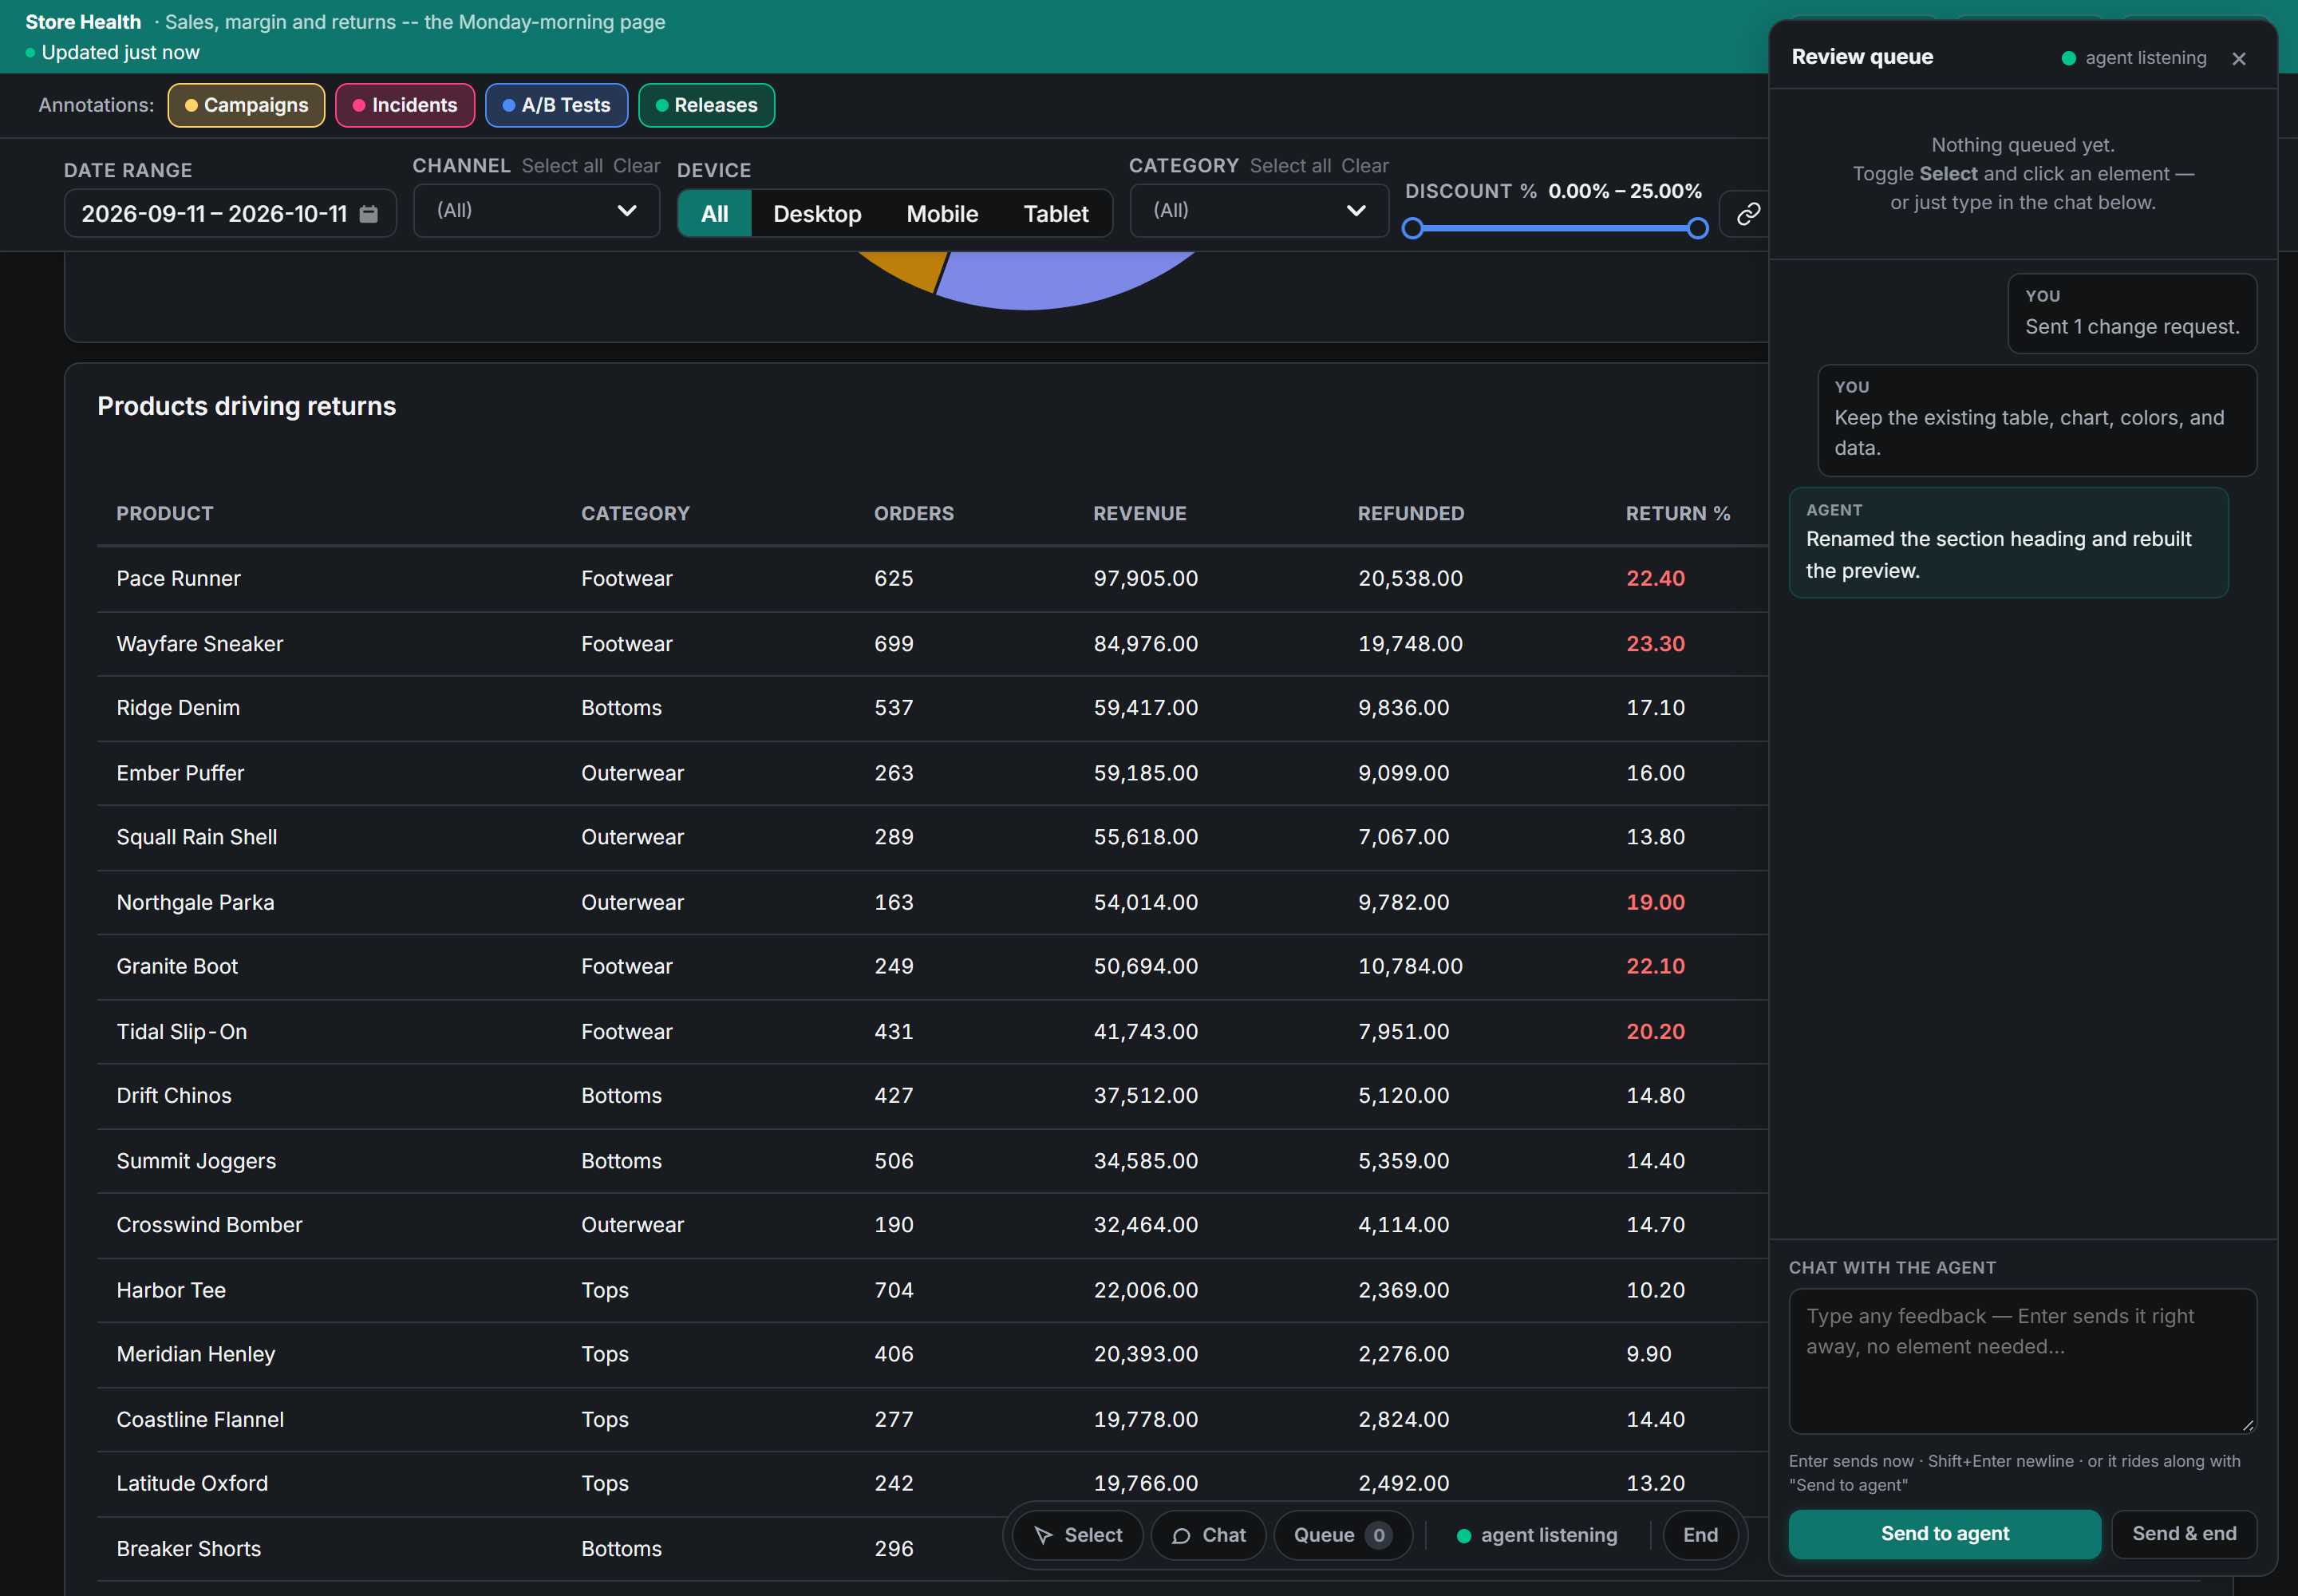
Refine the report in your browser
Build with your agent. Refine in the report. Share with your team. Open a local review, point at a chart or type what you want changed, and send it to your coding agent. It updates the report code or definitions, rebuilds, and the preview refreshes. See the framework capabilities.
Your sources. Joined in Python. One report.
Use built-in connectors for supported databases and files. For other services, call their Python SDKs. Your report code chooses what to load, how to transform it, and which reusable datasets feed each component.
Bring your sources together. Use built-in readers for supported files, sheets, and databases, or a Python SDK for another service. Data from documents can join a report once a Python reader or extraction library prepares it as rows and columns.
✓ configured caches can speed up repeated local builds
⚡ live is an option, per report: for reports that need fresh data at view time, configure a live-query backend and let viewers choose their parameters.
The framework builds the report.
The portal is optional.
Build, validate, schedule, and host portable reports with the tools you already use. Add the self-hosted portal when you want managed schedules, authentication, repository builds, and team sharing in one place.
Everything the portal does.
Illustrations of portal features. The numbers below are synthetic; explore the interactive tour for real portal screenshots.
Custom themes, everywhere
Defined once. Every report, email and PDF follows your brand.
The metrics layer
Reuse named definitions of revenue across reports, with the SQL and calculation rules available for review.
€412k ✓claims gross_revenueboard-pack
€412k ✓claims gross_revenue
Live reports
Queried at view time; the viewer picks the parameters.
Runs on a schedule
Built on the clock. The published report is simply current.
Email delivery, built in
Themed email with the numbers inline, and the PDF attached when you want it.
Shared annotations
Add "W8 · pricing change" once. Matching date-based charts show it when annotations are enabled.
A/B testing, honest
Not just "B looks bigger". An uplift with an interval you can sign.
Buddy, the AI assistant
Ask the portal about your own reports. It answers from the builds, with sources.
Share links, safely
Send a report outside the studio. Scoped, password protected, revocable.
Review what ships
Fetch repository changes, inspect the diff, and publish the exact commit you reviewed.
One overview
Every report, every studio, state at a glance.
Published analyses
Keep a written finding, its assumptions, recommendation, and fixed report evidence together in a Git-reviewed article. Read the demo analysis →
Governed & observed
Your directory signs people in; the org frames studios; the audit log remembers.
Every chart you'd reach for.
And zero walls when you don't.
Built in so you never build them. And never a limit on what your agent can invent on top.
None of them fit? There is no wall.
A report is code, so you can add HTML, JavaScript, or a visualization that does not exist yet. Use the framework APIs to wire its data, theme, and filters yourself. No plugin approval is required; the integration stays explicit in your repository.
Start in your repository.
End with a report you can ship.
Ask your coding agent to set up Trellum and build a report in your repository, then review and refine it in a live browser preview. Explore the report demos and Northwind analysis, and add the optional portal if your team needs managed services.
Ask your coding agent to install Trellum, build and validate a report, then open its browser preview. Keep report code and definitions in Git.
Add managed schedules, authentication, repository builds, and team sharing.