Where Northwind loses buyers
Decision brief · September 2026 · Synthetic demo data
Mobile brings nearly two-thirds of Northwind's sessions, yet only 1.80% end in a purchase, compared with 5.24% on desktop. Prioritize a mobile checkout investigation before running another cosmetic button experiment. The evidence identifies where to look; it does not establish the cause.
Question
Where should Northwind focus its next conversion improvement?
This analysis examines 1–30 September 2026, across all channels in the Cart Funnel report. It preserves the views used for this decision so the reasoning remains readable after the report refreshes. Northwind is fictional: the numbers, conclusions, and proposed actions demonstrate an analyst's workflow.
Findings
Mobile is the largest opportunity to investigate
Of 156,707 sessions, 99,072 were on mobile: 63.22% of the total. Mobile produced 1,782 purchases, compared with 2,358 from fewer than half as many desktop sessions. Overall conversion was 2.86% (4,477 purchases divided by 156,707 sessions).
| Device | Sessions | Purchases |
|---|---|---|
| Mobile | 99,072 | 1,782 |
| Desktop | 44,967 | 2,358 |
| Tablet | 12,668 | 337 |
| Device | Conversion |
|---|---|
| Mobile | 1.80% |
| Desktop | 5.24% |
| Tablet | 2.66% |
Conversion is purchases / sessions, using summed counts for the whole period. It is not an average of daily percentages or a unique-customer rate. Desktop is a useful comparison, not an achievable target we can assume for mobile; audience and channel mix may differ.
The gap extends beyond the final button
Mobile's purchase rate is 3.45 percentage points below desktop's. Several steps contribute to that difference:
| Step | Mobile | Desktop |
|---|---|---|
| Product view → add to cart | 16.57% | 23.09% |
| Add to cart → start checkout | 41.32% | 57.29% |
| Start checkout → purchase | 48.73% | 68.67% |
Each percentage divides the next stage's count by the preceding stage's count. The final step loses 1,875 of 3,657 mobile checkout starts. That makes checkout worth investigating, while the earlier gaps mean we should also inspect product selection and cart behavior. These aggregate counts do not tell us whether shipping costs, usability, payment errors, or buyer intent explain the losses.
Evidence
Mobile funnel
Reporting period: 1–30 September 2026. Device: Mobile. Channels: all. The final three stages are 8,851 carts, 3,657 checkout starts, and 1,782 purchases. Percentages printed inside or beside the bars compare each stage with the previous one; they are not the overall purchase rate.
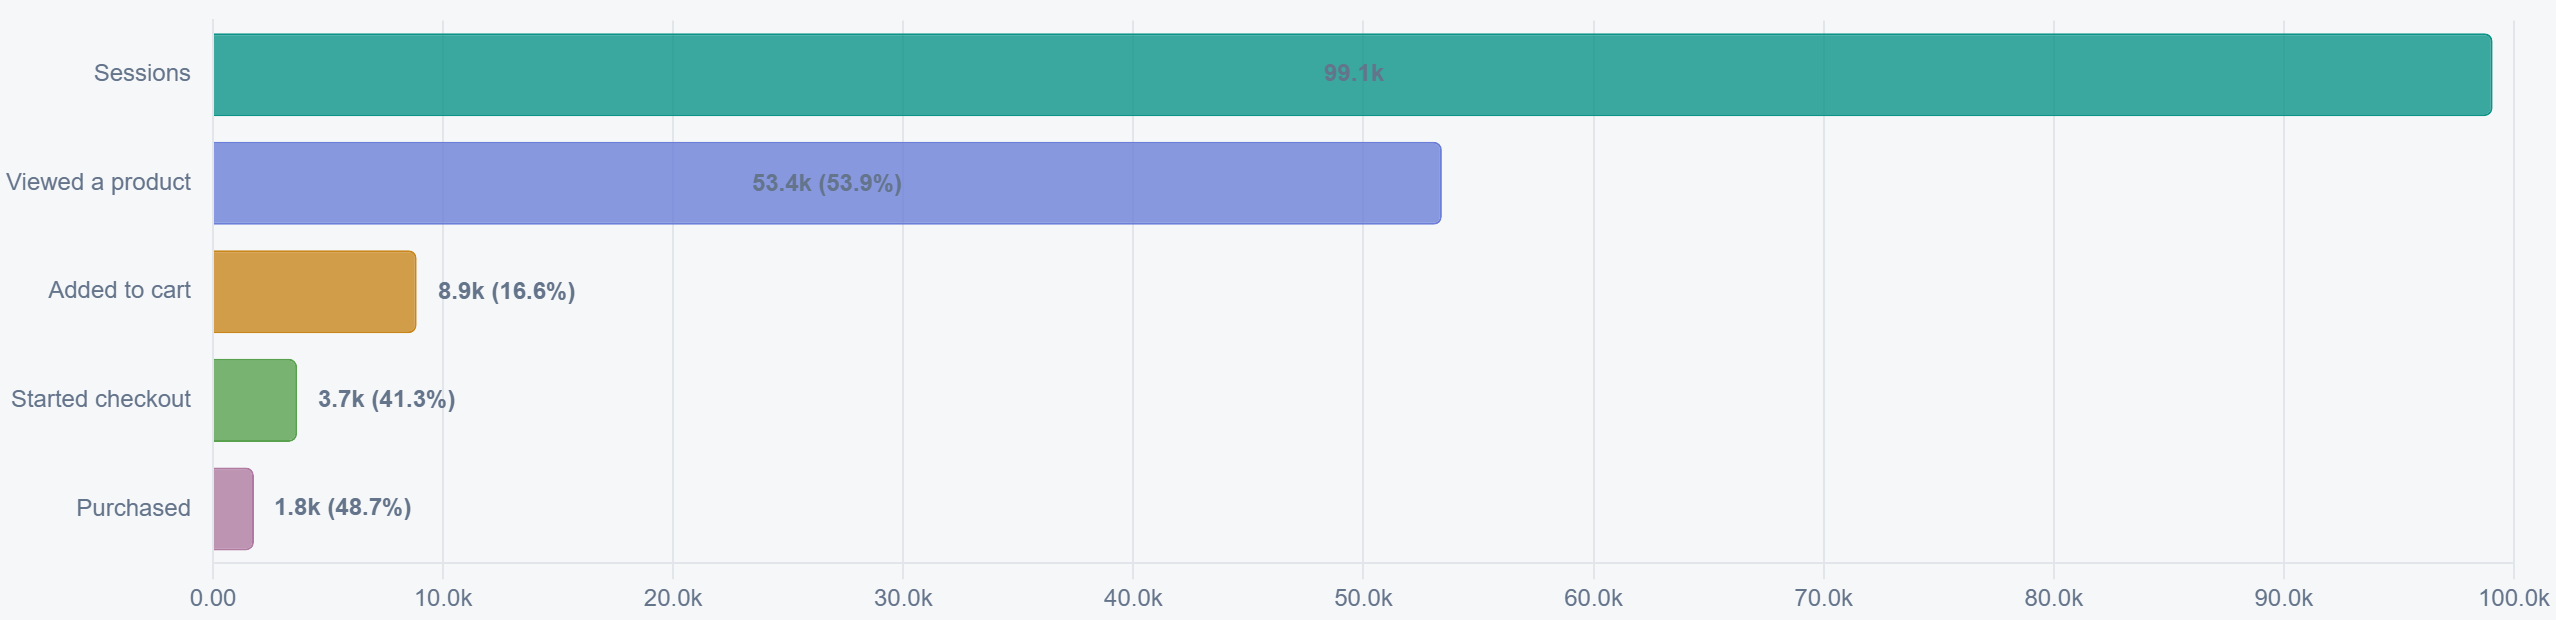 Report: Cart Funnel · Component: The Funnel · Captured: 7 Oct 2026, 21:26 UTC · Source built: 7 Oct 2026, 21:26 UTC · Filters: stages: event date from 2026-09-01 to 2026-09-30; device equals Mobile · Source report
Desktop comparison
Reporting period: 1–30 September 2026. Device: Desktop. Channels: all. The same report and date range yield 5,994 carts, 3,434 checkout starts, and 2,358 purchases. Compare the counts and percentages: each chart uses its own horizontal scale, so bar lengths are not directly comparable across images.
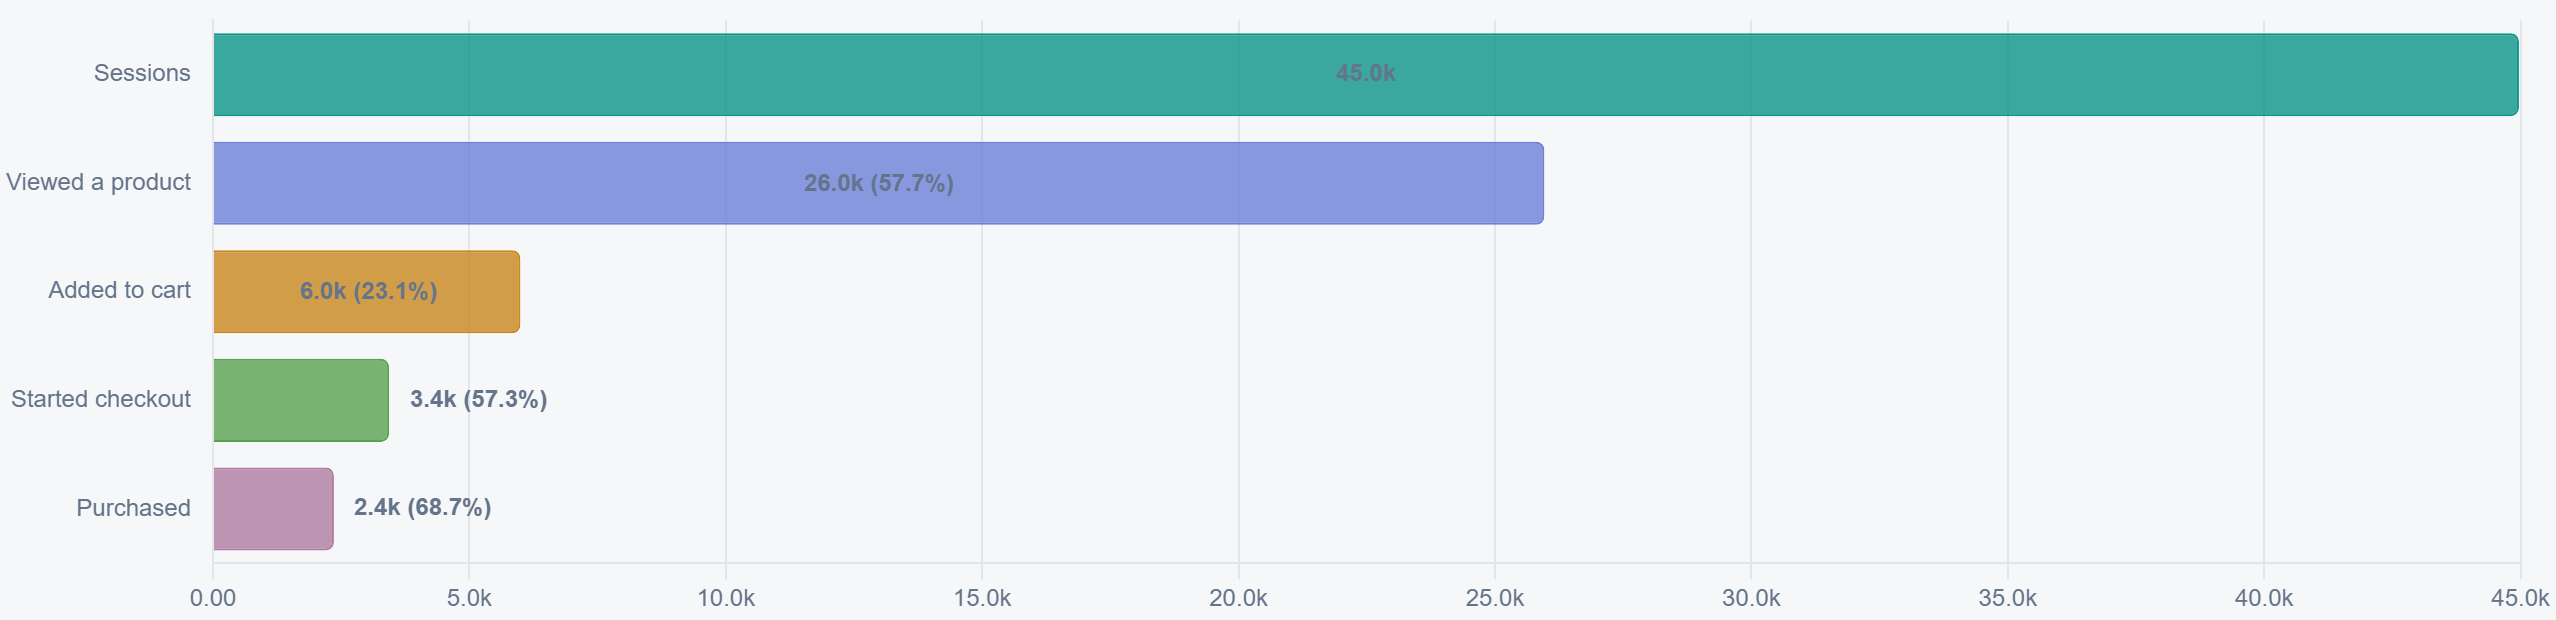 Report: Cart Funnel · Component: The Funnel · Captured: 7 Oct 2026, 21:26 UTC · Source built: 7 Oct 2026, 21:26 UTC · Filters: stages: event date from 2026-09-01 to 2026-09-30; device equals Desktop · Source report
The captions record the active filters, capture time, and source build time. Those timestamps describe the artifacts; September is the reporting period. These committed images do not change when Cart Funnel rebuilds. Its source link opens the current report, which may contain a different date range or regenerated demo data.
Assumptions and limits
- Synthetic, fixed snapshot. This example uses the full 420-day fixture ending 7 October 2026, seed 42. A fresh or small demo warehouse can produce different totals. The article remains a record of this snapshot.
- Aggregate stages. The demo supplies daily counts by device and channel, not linked session histories. We treat stages as a funnel for this example; real analysis must verify event definitions, deduplication, and order.
- Association, not causation. Device groups are not randomly assigned. Channel mix, returning customers, and purchase intent could explain part of the difference. This comparison does not measure an experiment's lift.
- No revenue forecast. Purchases alone do not establish revenue or margin. We have not assumed that mobile can reach desktop conversion.
- Source access is separate. Readers receive these published captures. In a private deployment, a source link still requires permission to open the underlying report.
Recommendation
Investigate mobile checkout first, then test a specific cause.
- Validate the measurement. Ask the analyst and instrumentation owner to reconcile checkout starts and purchases, inspect duplicate events, and split the mobile gap by channel and returning-customer status.
- Observe the experience. Ask the product team to review the mobile cart and checkout on common devices, including shipping-cost disclosure, payment failures, and form errors. Record the evidence before choosing a change.
- Design one focused experiment. If that work identifies a problem, write its hypothesis, eligible audience, sample-size plan, and stopping rule before launch. Use purchases per eligible mobile session as the primary measure; monitor revenue per session, payment failures, and refunds as guardrails.
- Publish the decision. Commit a new analysis revision with the test result and new evidence. Keep this baseline in Git history so reviewers can trace why the experiment was proposed.
We would reconsider the priority if the gap disappears after measurement corrections or comparable audience segmentation. Until then, the result is a prioritized investigation, not a claim that a particular redesign works.